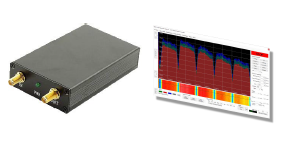
Waterfall chart using a Dr.HD 900S

Additionally, the meter provides A/V In- and Out-connectivity, so I rubbed my hands and implemented somthing I never found on any satellite meter (neither professional or hobby meters): a waterfall chart.
This will visualize a spectrum over time. For this, the signal level is displayed as colors, while the Y-axis represents time.
Such a waterfall chart is useful, since it will allow the use to examine which satellites have been captured during the movement of a satellite dish, i.e. when using a motorized dish or while aligning a dish manually. Imagine you moved too far: on the actual orientation the spectrum won't show any signal, but by reading the waterfall chart, you will see that you briefly aimed at the satellite.
Because a video will explain this better, I prepared two Youtube videos, which show the progress of my application:
Interested? Drop me a line!

Comments
Post a Comment