Some considerations about the limitations of the ADF4350/ADF4351/MAX2870
Regarding the SMA and NWT devices, I often receive these questions:
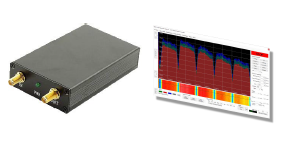
For example, this is how my local FM radio band looks like, when using my "SMA Simple Spectrum Analyzer" with ADF4351:


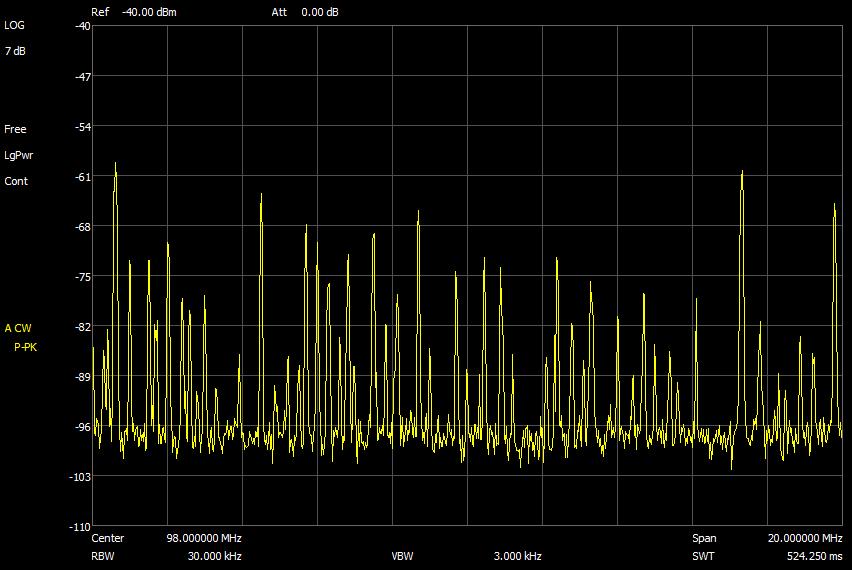
The frequency range is exactly the same (88MHz - 108MHz), but the difference is due to the fact that the Siglent SSA3021X is rendering the spectrum with a RBW of 30kHz, while the ADF4351 probably uses a RBW of more than 300kHz.
To explain the concept, here is the a signal captured with different RBW values:


- Why is there a "notch" in the spectrum?
- Why does the spectrum look different than expected?
- I compared the spectrum of the NWT4000 with the spectrum of my professional spectrum analyser and it looks much different... Why?
- ...
For example, this is how my local FM radio band looks like, when using my "SMA Simple Spectrum Analyzer" with ADF4351:

Here is the same spectrum rendered on my Siglent SSA3021X:
To explain the concept, here is the a signal captured with different RBW values:

RBW = 1 MHz

RBW = 100kHz

RBW = 30kHz
The Siglent SSA3021X is a "real" Sweeped Spectrum Analyser (hence the "SSA" in the name) and it allows to set the RBW as required. Imagine the RBW to be a window: the sample you grab is the average of what you see through the window. The narrower the windows, the higher the resolution, but the sweep will take longer.
In case of the SMA/NWT devices, we don't have a user configurable RBW. You can only determine a start frequency, a frequency step and the amount of samples you want to capture. The device will then sweep the frequencies - but at a constant RBW.
This GIF tries to show how the detector sweeps the RF spectrum:

The detector will AVERAGE the power level within its window. Unfortunatly, the way the device and its IC's were designed, it has a "blind spot" in the centre frequency of the detector. This is the culprit of the notches on signals with a narrow bandwidth.

When the detector is exactly in the middle of the signal, the blind spot will mask a significant part of the signal, which causes the sample to actually have a smaller power level than the neighbouring samples.
Note that the “blind spot” is not in the centre of the frequency span you are seeing on the screen, but in the middle of the detector used to measure the power level in each sample!
When the narrow band signal is narrower than the RBW of the SMA/NWT device, the samples that completely contain the signal will measure a smaller power level, than the samples where the signal is not completely contained inside the detector window.

Here some extra information on spectrum analysis:
FFT - Fast Fourrier Transformation
In this case, the device will digitize a given amount of samples in TIME DOMAIN. This is much like a digital oscilloscope: you digitize for example 2000 points in one second.
Imagine the signal is a sine at 100MHz (in other words, the period of the signal is 1/100000000 seconds). Capturing 2000 points will allow you to calculate the sine function matching the samples through FFT math. You can then render the function in FREQUENCY DOMAIN, as you know the amplitude (signal level) and frequency.
This is how SDR# works for the RTL2830 based DVB-T dongles.
Advantage: very fast spectrum rendering
Disadvantage: limited span and you need a fast processor to do the maths!
SSA - Sweeped Spectrum Analysis
Here you take the input signal and convert it down to your BAND PASS FILTER. In a good device, the appearture of the filter is configurable (i.e. 10kHz, 100kHz, 1MHz). The filter always operates at a fixed frequency span, so instead of sweeping the filter across the frequency span, the frequency is downconverted accordingly (in the animation of my blog entry, the detector is fixed and it is the frequency ranges that moves).
Next comes the detector: it measures the signal power of the signal leaving the band pass filter.
So the very simplified schematic would be:
INPUT > FREQUENCY CONVERTER > BAND PASS FILTER > DETECTOR
Please note that my explanations are very simplified!
Interested in a deeper insight? Make sure you read this great document from Keysight, a manufacturer of premium spectrum analysers:
Final word:
The SMA/NWT are great devices, considering their prices - no doubts about it. One just has to accept the limitations...
Regards,
Vitor

Comments
Post a Comment