Testing the Arinst SSA-R2 TG
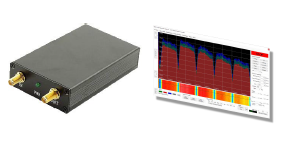
Arinst SSA-R2 TG

One of the most frequent questions I receive from people that purchased a “SMA 35-4400 Simple Spectrum Analyzer”, a “NWT4000”, a “NWT6000”, a “D6” or a “LTDZ” device (which I abbreviate as SMA/NWT/D6/LTDZ) is:
What is the next best low-cost spectrum analyser on the market?
This question relates to the fact that the above mentioned devices have several issues:- Slow sweep rate
- “Notches” on small bandwidth signals
- Require external software (you can use WinNWT/LinNWT, SNASharp or, of course, my “VMA Simple Spectrum Analyser”)
- Lack of precision (amplitude and frequency) – these can be partially compensated by software
So, what options are there, to step up and get a better device?
I know of the following options:- TinySA:
The main selling point of the low-cost TinySA is the advertised price of around 50 US$! Hard to beat this price and the functionality of this small device is actually pretty awesome. But there are issues:
- Most shops at eBay, AliExpress, etc., are selling fake devices, which do not pass the self-test. They work, but at questionable specs.
- The few official sellers are located outside the EU, so be prepared to pay shipping and customs. This makes the effective price to be around 100 Euro.
- The TinySA is getting new revisions, for example with better shielding. It is frustrating to not know what revision you are buying. You may get the newer and better version or the older one…
- I made a version of my software for the TinySA. While it is already working, I found that the protocol implementation is not perfect, yet. As a result, the sweep speed decreases with decreasing spans, which is, to say the least, odd.
- Does not support TG (Tracking Generator) functionality, despite being able to operate as a signal generator.
- The biggest issue, however, is the reduced frequency range of the TinySA: 0.1MHz-350MHz at “high quality” and 240MHz-960MHz at “lesser quality”… - Low-cost professional spectrum analyser:
- Rigol DSA series
- Siglent SSA series
- Signal Hound USB-SA series
Sure enough, at starting prices of around 1500 Euro upwards, you get a professional grade spectrum analyser. But, this price range is probably a bit out of reach for most hobbyist users - Second hand professional grade spectrum analyser:
If you are willing to take some risks and are able to do some repairs when something fails, a second hand spectrum analyser might be a good options. However, prices are normally unreasonably high, when compared to brand new devices from Rigol, Siglent or Signal Hound. - Arinst SSA:
This is the device I will discuss in this post!
There are currently three versions of the Arinst SSA:
- SSA-R2: This cheaper model does not include tracking generator capabilities and as such cannot be used to measure DUT’s like filters, crystals or antennas.
- SSA-R2 TG: This is the model I have and will be testing. It includes two connectors, one for RF-IN and one for TG-OUT
- SSA-TG LC R2: This device is similar to the SSA-R2 TG, but it does not have any screen or buttons, apart from the power button.
Connection is done through Bluetooth or USB, the latter creates a virtual COM port and the protocol is described in a PDF document, which can be downloaded. This allows anyone to build their own software.
Examples are available for Java and Matlab, which is a common tool within an academic environment.
These devices are designed and made in Russia and there is little information available in English about them, which is why they are so unknown.
My interest and review is relative to the Arinst SSA-R2 TG version, which claims to be a portable spectrum analyser with tracking generator for field use.
It is sold for around 335 Euro, plus 30 Euro shipping (DHL). Add customs and you are looking at around 435 Euro if you handle customs yourself. If you choose to have DHL take care of this, note that DHL charges for the customs handling service:
|
Declared Value |
DHL Service Fee |
|
< 200 Euro |
30,30 Euro |
|
201-300 Euro |
49,70 Euro |
|
301-1.500 Euro |
74,60 Euro |
(This values were provided to me by the Portuguese DHL office,
rates might be different in other countries)
Depending on the declared value (you might try your luck declaring a lower value) you might have to add a whopping 74,60 Euro for customs handling!
So, by doing everything correctly, the SSA-TG R2 costs about 400 Euro shipped.
Note: I discourage the attempt of declaring a lower value for this device, as at least here in Portugal, customs will request proof of payment. And attempting to cheat on the package value is considered a crime, which is punished by law.
While products from Arinst are listed on Ebay and AliExpress and were often suggested to be when searching for spectrum analysers, I never found much information, especially user feedback.
So I decided to test this equipment for the common benefit!
Here is some initial information about Arinst and the SSA-TG R2:
- Website of Arinst:
- · Russian: http://arinst.ru
- · English: http://arinst.net
- Online Shop:
- Russian Shop
- China and Taiwan Shop
- Japan Shop
- Youtube:
- This search does show some reviews of the SSA-TG R2, however, most are in Russian language: https://www.youtube.com/results?search_query=arinst+ssa-tg+r2
Without further delay, here is my test review of the Arinst SSA-TG R2 and what I think of it:
Unboxing
After dealing with DHL (which would lead to a whole separate story) and having the package finally in my hand, the first surprise was that the Arinst SSA-TG R2 is actually bigger and more massive than I expected from the pictures. It is definitely bigger than the TinySA and a few magnitudes more solid, thanks to its full aluminium body.
Side views with RF In/Out connectors on the left side, USB and Power button on the right side:


The package contains the device packed in protective foam and two SMA male-female connectors. These are useful if you intend to connect and disconnect cables many times. By attaching these connectors, they can be kept on the device, thus wearing their thread instead of the connector’s thread. It is easier to replace these connectors than the ones soldered to the device. That’s a nice touch by Arinst!

First test
Switching it on, the device boots in about 3 seconds. The booting in indeed very fast. To switch the unit on, the power button needs to be pressed for 2-3 seconds (to prevent accidentally switching the unit on), which feels as long as the boot process itself.The SSA-R2 TG boots into the last state, which is nice, so if you switch it off after measuring a given signal, turning in on will restore all settings. This is incredibly useful, especially for the targeted field use, as this way you do not refrain from switching the device on and off according to your needs. More than often I have stood on the roof with a field meter, which I kept switched on, so that I would not have to endure the booting sequence, when I was ready for the next measurement. The price of leaving your device switch on permanently is of course a much reduced battery autonomy.
Speaking of battery, the SSA-TG R2 uses a big sized internal lithium battery. It provides a really extensive autonomy of over 4 hours!
Of course, the first test I did on the SSA-R2 TG was to feed it with known signals to determine the frequency precision.
For this I simply connected the CAL OUT of my aged, but fully working HP 8594E spectrum analyser to the RF Input of the Arinst SSA-R2 TG. The HP8594E produces a test signal at 300.000MHz, which is used for auto-calibration.

Once connected to the Arinst, it measured the test signal spot-on at 300.00MHz!

Reducing the span and activating the waterfall diagram:

Using the same cable, but two different connection adapters (F-N and F-SMA) the test signal was measured by the HP 8594E at -20 dBm and on the Arinst SSA-R2 TG at -22 dBm.
This is a very good result, considering that my Rohde&Schwarz CMU200 measured the signal using the same cable and connectors as the HP8594E at -23.1dBm and centre frequency of 299.991055MHz.

The Arinst SSA-R2 TG is able to render the spectrum as a waterfall diagram, splitting the screen area in half: the upper half will show the regular spectrum and the lower half will show the waterfall diagram. This is very useful when aligning an antenna, as the waterfall diagram acts as history where the installer can monitor the highest reception achieved, while moving the dish.
Also, any intermittent signals are captured and made visible.
Speaking about the waterfall diagram always makes me remember that documentation of the carried out measurements is an important aspect, especially when doing measurements on the field. Unfortunately, the Arinst SSA-R2 TG does not allow to record the measured spectrum or, at least, take screenshots. However, when I opened the case, to check what is inside, I noticed what seemed to be a SD card reader. Perhaps Arinst will surprise us in the future with a firmware update that allows recording to a fitted SD card…
Anyway, this is not that much of a deal, because one has to remember that it is possible to connect the smartphone to the Arinst via Bluetooth at any time and simply capture screenshots on the smartphone!
The required app is available on the Google Play store and after setting up the Bluetooth connection, the software immediately recognizes the device and shows the spectrum. Of course this works on an Android tablet, too.
The following video shows a small walkthrough of the Arinst SSA-R2 TG GUI:
Testing Satellite TV reception
One of my passions is the receptions of DTH (Direct-To-Home) satellite transmissions, normally called Satellite TV.Aligning a satellite dish can be a real challenge, especially bigger dishes (the bigger the dish, the more precise alignment have to be). Add to this multi-feed reception (using more than one LNB) and motorized dishes (in this case the arc that the dish describes when moving has to match the alignment of all satellites) and you can guess how many hours can be spent getting the best reception possible.
A field meter is helpful by showing a spectrum with a fast refresh rate. Since professional field meters are expensive, why not use a low-cost spectrum analyser to do the job? The only issue is that the LNB needs to be powered (13V/18V – the two voltages switch between V/H polarisation) and a 22 kHz signal can switch between Low and High band. Since a spectrum analyser does not provide this, one has to use a satellite receiver and connect the spectrum analyser to the LOOP THROUGH connector.
WARNING: This connector usually passes not only the down converted satellite signal, but also the 13V/18V and the 0 kHz/22 kHz signal. In order to not immediately destroy the input port of the spectrum analyser, it is mandatory to use a DC Blocker.
Here is a picture of the spectrum of Astra 19.2E rendered by connecting the LOOP THROUGH port to the SMA4400 (the low-cost version of the NWT4000), using my VMA Simple Spectrum Analyser software:

The refresh rate is about one complete sweep every 3 seconds.
Here the picture of the same signal captured directly on the Arinst SSA-R2 TG:

And the next picture shows the same signal on the smartphone connected via Bluetooth:

The refresh rate is about 1-2 seconds, which makes a clear difference to the SMA/NWT devices.
However, the transponders are not rendered as nicely as when using my VMA Simple Spectrum Analyser software in combination with the SMA/NWT devices.
Intrigued by this, I fired up Dektec StreamXpress and using my DTA-2115 Modulator, I generated a DVB-S2 transponder at 1450MHz.

The Arinst SSA-R2 TG rendered this beautifully with a span covering 950 MHz up to 1950 MHz:

And, with a small span of 50 MHz:

At this point I am not sure why the satellite signal from the LOOP THROUGH port did not render the individual transponders better.
Still, the Arinst SSA-R2 TG is useful for satellite dish alignment. The following picture shows the spectrum of Hispasat 30.0W, a satellite that is less crowded than Astra 19.2E:

The next picture shows the dish rotating back from 30.0W to 19.2E:

The waterfall diagram is extremely useful, as it shows the different satellites on the way!
Testing DVB-T reception
Another standard test I do is to measure the local DVB-T transponder and here the Arinst SSA-R2 TG performs fantastically, due to its low noise floor. The following picture speaks for itself:

Thanks to the very low noise floor of the SSA-R2 TG, I could not only clearly monitor and measure the local DVB-T transponder at 594MHz: I could see the alternative transponder at 642MHz, which is covering the neighbouring region.

This is something that is definitely not possible on the SMA/NWT/D6/LTDZ devices, since their noise floor is above -80dBm (in case of the D6 and LTDZ the noise floor is even higher, at around -70dBm).
Also, notice the use of the two markers, manually placed on both DVB-T transponders.
Testing FM radio band:
Measuring FM radio transponders is a problem with lower cost devices like the SMA/NWT/D6 and LTDZ, as they produce a notch on small-bandwidth signals. This is really annoying, as the following picture shows:
The Arinst SSA-R2 TG shows the FM radio band with a nice clear spectrum, where each radio station can be easily identified (the picture shows the exact same signal and start/stop frequencies):

While it is of course possible to further narrow down the span, the only major drawback of the SSA-R2 TG becomes visible: it uses a fixed RBW of 200 KHz. This means that it is difficult to resolve signals with a significantly smaller bandwidth.

Performing filter measurements
A common application for spectrum analysers is the measurement of filters. To do this measurement, it is mandatory to have a tracking generator (TG) available. This is basically a signal generator that will sweep the output frequency in sync with the spectrum sweep.The Arinst SSA-R2 TG mastered this measurement surprisingly well. I must confess that I was really impressed, since the signal generator menu not only offers discrete signal generation with adjustable signal power over the whole supported frequency range (35MHz – 6200MHz).

It is noteworthy that the signal generator can work simultaneously to the spectrum – this is not possible on the cheap SMA/NWT/D6/LTDZ devices and by itself a valid reason for the upgrade. The TinySA is even worse in this aspect, as it either runs in spectrum analyser mode or as a signal generator, not supporting any TG functionality at all.
Regarding the TG mode, the Arinst SSA-R2 TG surprises with the possibility to measure in S21, S11 and SWR mode. Also, the TG can be set to automatically normalize the signal. This is done by connection RF Out directly to RF In and then clicking the “Normalize” button.
The signal will appear with a “Freq. Lock” note and the frequency range cannot be edited until the “Normalize” mode is deactivated.

As a result, the default signal will be a straight line at 0 dBm over the selected frequency range.

If the DUT is now connected between RF Out and RF In, the Arinst SSA-R2 TG will show the resulting change in the spectrum. In my example, I measured an LTE filter, which should attenuate the signal at 790MHz:

An indeed, one can see an attenuation of more than 60dB. The filter works as expected and the Arinst SSA-R2 TG mastered this practically in real-time.
Next I tested a band-pass filter as used by CATV operators to limit the channels that a customer can watch. For this I increased the frequency span from 50MHz up to 2000MHz:

After normalizing the TG, I attached the filter and got this result:

The characteristic of this filter can be clearly measured and of course it is possible to position up to 4 markers freely, for instance to measure the start and stop frequency of the bandpass-filter.
The performance and precision of the Arinst SSA-R2 TG was on par with my CMU200 spectrum analyser.
Finally, I made a test with my RF bridge. This allows SWR measurement, as well as, other measurements like measuring distance to fault by measuring the peak distance of the resulting pattern:

Note that I did not perform the normalization for this measurement and the screen therefor shows “UNCAL”.
The GUI of the Arinst is very intuitive and increasing/decreasing the span or changing the start/stop frequencies is done by just pressing the respective buttons.

The above pictures show the use of two markers. These have been moved using the cursor keys to two adjacent “valleys”. The delta value of 76.04 MHz can be used to determine the length of the unterminated cable or distance to fault. All that is required is to know the cable v/c (in my case the coaxial cable has a v/c value of 82%).
The cable length or distance to fault is calculated by applying the formula:
Cable Length or Distance to Fault = Speed of Light / (Measured Span * Cable v/c) * 0.5
In my case, the cable length of 1.6m was correctly determined.
Over the two weeks I have been using the Arinst SSA-R2 TG, I got more and more addicted to it and it made me switch my professional spectrum analysers less and less. It is simply a tremendously convenient and simple to use equipment.
What is inside the device?
I took a quick peek inside the SSA-R2 TG and found professionally made PCB’s with excellent engineering and good shielding:

The other side contains the main circuit:

The input and output have their own shielding and I obviously did not remove it.
The main processor is an ARM STM32F405, which, according to its datasheet, contains an “Arm Cortex-M4 core with DSP and FPU, 1 Mbyte of Flash memory, 168 MHz CPU, ART Accelerator”
The component with the “5233” sticker is the Bluetooth module!
The design of the SSA-R2 TG is interesting, as Arinst put the circuit facing the backside of the device. The other side of the PCB has a large Lithium battery attached to it, acting as some kind of extra shield to the LCB PCB, which is mounted on a spacer, together with the keyboard PCB.

Conclusion
The Arinst SSA-R2 TG is an excellent spectrum analyser for many different applications. Its incredible frequency range from 35 MHz up to 6.2 GHz covers most applications, especially in hobby or field applications.While the manufacturer explicitly informs potential customer that this device should not be expected to perform like a laboratory class spectrum analyser:

The truth is that the performance was on par with my professional grade spectrum analysers on most aspects.
The main missing feature of the SSA-R2 TG is the possibility to adjust the RBW (resolution bandwidth), which is fixed at 200 kHz. This means that the device cannot resolve signals smaller than this fixed RBW, decreasing the span further, just results in a wider Gaussian curve.
Other limitations include the fact that only one configurable trace can be shown next to the live trace. It is not possible to render the MIN and MAX trace simultaneously. Not exactly a big deal, but would be nice to have.
Other than that, the Arinst SSA-R2 TG is definitely a big step up from cheaper devices like the NWT4000 and fully recommended for all those that cannot justify a >1.500 Euro price tag for a Siglent SSA3021X or SSA3021X+.
But this device does not only appeal to hobbyist that want or need to measure the RF spectrum! I do own some test equipment for mobile communication, digital terrestrial television and CATV. These are ridiculously expensive and at the end of the day, it all comes down to looking at the spectrum. Sure, it is nice to have a constellation diagram, power measurement and what not. But to check signal distribution over the air or over the cable, the Arinst SSA-R2 TG gets the job done at a fraction of its price and with an incredibly easy to use user interface.
Also, by allowing a Bluetooth link to a smartphone, tablet or computer, documenting the field measurements is made easy.
I will be looking at the protocol of the Arinst SSA-R2 TG (which is compatible within the whole range of devices) and probably publish a dedicated version of my “VMA Simple Spectrum Analyser” software for it.
Arinst has excelled itself and produced the best low-cost spectrum analyser I have seen so far and believe me, I have most of them on my desk…
Final verdict
Unless you need to explicitly measure with an RBW under 200 kHz, the Arinst SSA-R2 TG is a great option for a low-cost, all-purpose spectrum analyser. At its price there is no similar competitor that I know of and the next viable option costs three times more (Siglent SSA3021X).Notes:
This first test report does not cover many of the nice features of the Arinst SSA-R2 TG, so expect a follow up post to talk about the GUI and, especially, the external application, that runs on Android, Windows, MacOS and Linux.Also, I will in some near future try to port my VMA Simple Spectrum Analyser to this fine device.

It is an excellent description. In fact, the manufacturer says from the start that it does not go below 200Khz. However, between it and Siglent is the distance from Earth to the Moon if we want to adjust a filter.
ReplyDeleteIt looks like a great product for hobbyists. I was considering to buy the cheaper SSA-TG LC R2, until I read in the documentation (http://arinst.net/files/Manual-Spectrum_Analyzer_Arinst_SSA-TG_R2-ENG.pdf) that "measured frequency range" is different from "displayed frequency range" :
ReplyDeleteSSA-TG R2: "measured frequency range" is 35-4500 MHz while "displayed frequency range" is 35-6200 MHz.
For SSA-TG LC R2, "measured frequency range" is 36-3000 MHz while "displayed frequency range" is 36-5990 MHz).
Maybe I am missing something, but what is the purpose to display frequencies that the hardware could not measure... ? Can we really say " Its incredible frequency range from 35 MHz up to 6.2 GHz" ? (while it's rather "up to 4.5 GHz" or "up to 3 GHz" respectively if the measured frequency range is what matters)
What is meant by displayed frequency range and measured frequency range is this:
DeleteThe device is able to sample frequencies up to 3GHz/4.5GHz with high accuracy and low noise floor.
The higher frequency range is sampled with less accuracy and higher noise floor (possible due to internally using the second harmonic for frequency conversion) and as a result, the measurements are not accurate and cannot/should not be used as absolute values. But the displayed spectrum is still meaningfull to monitor the frequency range for any signal.
I just found this "SA6" product https://www.ebay.com/itm/284550136673 which looks very similar to the Arinst (both visually and from the tech specs, and I could also find it for as low as 175 € on Aliexpress) so it seems like an amazing bargain. But I wonder whether it is safe with regards to hardware quality and I lack background on the manufacturer (is it an illegal Arinst clone ? Is it the "real" Arinst product which they would try (as a Russian company) to resell through China considering recent events ? Is it a completely different product ?). Do you have an opinion or more informations ?
ReplyDeleteHello,
DeleteI don't know this device, but I am pretty sure it is an unofficial clone.
No idea if this will work like the original and I will not support it, as it will without doubt harm Arinst.
Also, consider that Chinese clones (SDR, HackRF, etc.) usually are designed to be as cheap as possible in production, so they will use lower spec components.
Regards,
Vitor
Have you checked the new tinySA 4 ("tinySA Ultra") ? https://www.tinysa.org
ReplyDeleteSignificantly cheaper, ability to measure up to 6 GHz in "ultra" mode (https://tinysa.org/wiki/pmwiki.php?n=TinySA4.Ultra ). Ability to have a resolution BW down to 200 Hz... I would be really curious to know how the performance might compare with the Arinst.
I will receive the TinySA Ultra on Christmas...
DeleteI plan to review it and add support for this device in my "VMA Simple Spectrum Analyser" software.
As already pointed out by the "IMSAI Guy" (https://www.youtube.com/@IMSAIGuy), the TinySA Ultra uses harmonics to downmix the upper bandwidths. This means that the DUT will receive a signal from the input port of the TinySA Ultra, while it is sweeping. This may or may not be a problem.