Review: Deviser S7200
Deviser S7200

The ultimate TV meter for TV, CATV, SAT, IPTV and fibre with integrated TS analyser and full spectrum analyser.

Can you find the new S7200? It's the one with the HUGE screen on the left!

Are these two spectrum analyser? Yes, but the S7200 is actually a full TV analyser, which happens to feature a full spectrum analyser!

After getting used to the S7200, one notices the lack of demodulation of DVB signals on the dedicated spectrum analyser...

The S7200 is a smaller form factor than the S7000, but the screen is much bigger! Also, you can easily hold it with one hand, which is very nice.

So much thinner!

Notice how the ASI In/Out ports and the CI have moved to the side panel.

Smaller, thinner, bigger TOUCH screen, faster, more functionality, bigger harddisk - everything is better on the S7200 and don't forget how great the S7000 is to begin with...
Deviser is
a well-known manufacturer from China, with a secondary headquarters in the USA,
which is known for its HF measuring instruments. Deviser develops and
manufactures professional equipment and in this case “China” stands for highest
level in R&D!
The Chinese website is: http://www.deviser.com.cn/
The US website is: http://www.deviser.com/ and http://www.devisertek.com/
The German distributor is: http://www.symarix.de/
The Chinese website is: http://www.deviser.com.cn/
The US website is: http://www.deviser.com/ and http://www.devisertek.com/
The German distributor is: http://www.symarix.de/
The Deviser
S7000 has been tested by myself for TELE-audiovision 4 years ago, and I can
recommend to any reader to review the test report of the S7000: even at that
time, the meter was convincing in its entirety, both in the range of functions
and in the measurement accuracy.
Here are the links:
Here are the links:
When I got
the S7200 as pre-production device for the test from the foreign exchange, I
had to ask therefore, what could be better at the S7200, because the S7000 is
still in my test centre is still in use and leaves nothing to be desired.
As a side
note, TELE-audiovision unfortunately ceased its operation, hence why I publish
this test report on my blog.
To start
with, here are the new features of the S7200, compared to the S7000:
- Touchscreen: Yes! You can now directly touch the functions on the screen or, for example, move the markers with your finger. Great: you can zoom in and out with two fingers in the spectrum, pull the frequency left and right, adjust the amplitude up and down - everything works just as you would expect from an iPhone. The operation improves enormously, but you can still use the device with the mechanical keys – i.e. if you have dirty fingers and want to maintain the screen clean.
- Operation: Deviser has not simply further developed the S7000. Instead, Deviser took the design and control of its spectrum analysers and used them as the basis for the S7200. Therefore the operation and the external appearance now resembles other Deviser test equipment. This allows for optimized GUI development and easier learning curve for the user when different Deviser devices are available.
- Spectrum analyser: Deviser not only took over the housing and the user interface from the test equipment line, but also the spectrum analyser function. This means that the S7200 is not a TV/SAT meter with some reduced spectrum analyser functions – it is indeed a true spectrum analyser with integrated TV/SAT field meter! If the spectrum analyser in the S7000 is already well above average for this device segment, the spectrum analyser in the S7200 surpasses everything I have been supplied in the test centre.
- Fibre-optic input: The S7200 has been equipped with a fibre-optic input, which can also be used to measure optical signals. These are converted internally to HF signals and can then be analysed with the various measuring functions.
- Network: The S7200 now offers two RJ-45 jacks and can be connected to the network twice. Why? One network port can be used for IPTV, while the second network port is available without restriction for the remote control of the meter. Two ports? No: with the WIFI option, there are three possible network connections...
- The housing is flatter, which makes the S7200 slightly smaller (although width and height remain the same). The new touch screen, on the other hand, is somewhat larger than the S7000 screen. The protection bag has been enormously improved and battery autonomy has been extended (up to 8 hours of operation).
- TS Analyser: The integrated TS analyser, which was already available in the S7000, has been improved again and now, for example, the bandwidth can also be displayed as a cube diagram. This is extremely useful as one can be recognize immediately, which services in the stream need which bandwidth or whether a service is not active at all.
- Instead of 20MB of internal memory for screenshots, the S7200 has the option of using a 32GB SSD hard disk from which a whopping 29GB is available for screenshots and transponder stream recordings. And yes, I am talking of recording the full TS stream – not just one or few services contained within!
Of course,
there are other differences and improvements, which I will discuss in the
following review.
Since it is
a pre-production test device, I have received it without further packaging and
accessories. The device came only with the power supply, which provides an output
of 12V with a maximum current of 5.0A. Thus it is also compatible with the
S7000 measuring instrument. I welcome this because if you already have an S7000,
you do not have to worry about which power supply belongs to which measuring
device when purchasing an S7200.
The same
applies, for example, to the external GPS mouse that came with my S7000: it
works directly with the S7200.
Description of the device
The S7200
differs externally from the S7000 because it is based on a different hardware
platform. It looks much more similar to the DS2800 (cable TV analyser).
The front
panel consists of a giant screen with six buttons: channel list, file manager,
direct saving of the current screen, a key for an auto test mode, which under
the current firmware is not yet provided with any function, a button for the
settings menu and the HOME button.
Three key
groups are located to the right of the display. The top has three buttons for
quick access to the TV analyser, the spectrum analyser, the selection of the
signal input (HF, optical or ASI), as well as, the voltage output (for LNB,
DiSEqC and amplifier).
In the
middle are the cursor keys (up/down and left/right), as well as a backspace and
the ENTER key.
The lower
keypad contains the numeric keys with alphanumeric labels and a Delete key.
On the
lower right there is a separate power-on button and a status LED to indicate
the battery charging process.
Side panels
On the left
side are the ventilation slots and a practical loop, which allows you to hold
the S7200 safely without the bag. Due to the versatility of the S7200, it will
be used with or without a bag, depending on the application: on the roof,
certainly with a bag and neck strap, in the head station or in the laboratory
rather without a pocket.
On the
right are the Ethernet connectors, the USB jack, power plug, CI slot for a CAM
as well as ASI input and output.
The top
contains the RF input and the optical APC input.
Unlike the
S7000, there are no inputs on the back and this is good, because the access to
the ASI inputs and outputs was a bit fiddly on this model. There is slot for
Kensington-compatible locks. And yes: I have looked and this slot goes not only
by plastic, but also features an inner metal housing. If you want to get rid of
the S7200 from the lock by force, it wouldn’t be an easy task due to its
robustness.
Spectrum analyser
The great
highlight of the S7200 is undoubtedly the integrated spectrum analyser. I mean
actually an integrated spectrum analyser and not a simplified spectrum analyser
mode as is usually present in TV measuring devices.
Deviser has
installed a complete spectrum analyser in the S7200, or rather, as whispered to
me by the development engineer, the S7200 is actually a true spectrum analyser
to which the TV measurement function was added.
From Deviser’s
point of view, this makes sense, of course, because in the development and
production, similar to the car industry, the same hardware can be built and the
operation and even the housing become more uniform, reducing costs.
For the
customer, it is also a big advantage: the functions of a spectrum analyser go
far beyond the traditional spectrum analyser mode of an ordinary TV meter and
since Deviser offers a range of measuring devices, the integration into the
various devices is all the easier.
For most TV/CATV/SAT
field meters, spectrum analysis is an important component of the measurements
to be carried out. On the spectrum, for example, a satellite can be detected
immediately before the signal can be locked, which makes the alignment of a
satellite antenna immensely easier.
For these
measurements, the spectrum analyser can be constructed quite simple: usually
fixed values are sufficient for RBW, VBW and SWEEP. Even the span can often not
be chosen freely, but only in predefined steps. This reduces the cost of the
spectrum analyser, but the measuring possibilities are also reduced if one has
special measurement tasks.
For a true
spectrum analyser, the user can configure RBW (Resolution Bandwidth), VBW (Video
Bandwidth),
and SWEEP as required, with the SWEEP speed set according to the selected RBW
and VBW, and normally set automatically by the spectrum analyser.
A
heterodyne spectrum analyser is based on the fact that a mixer runs the
frequency range and converts the current frequency into the input frequency of
the analogue-to-digital converter (ADC). The resolution bandwidth RBW
determines the step width: the larger, the faster the spectrum can be
displayed, the smaller, the higher the resolution shown.
The video
bandwidth functions like a filter to minimize the background noise produced by
the spectrum analyser. This is achieved by averaging the measured values
digitized by the analogue-to-digital converter.
The speed
at which the frequency range is passed by the mixer is configured with the
SWEEP parameter. As a result, the question frequently asked by TV measurement
devices is "how fast is the spectrum". With a true spectrum analyser,
the speed of the spectrum can be adjusted more or less freely. But as always,
there are limitations. If you select a too small SWEEP value, the spectrum is
displayed faster, but the ADC cannot digitize a sufficiently large number of
samples and the signals are not visible.
In addition,
there are settings for displaying the signal: maximum values, minimum values,
average values. Up to four independent curves, called "trace", can be
defined and displayed as desired. For example, you can represent the maximum,
minimum, and mean value of the spectrum at the same time!
This sounds
terribly complicated at first, but here the all-clear: if you put everything on
AUTO, then you can go directly with the S7200 without tedious study or learning
and still get the best spectrum, which I have seen so far in a TV meter. In a
natural way, you will quickly discover the various spectrum functions and you
will quickly get a lot more out of the spectrum, as you have seen before: suddenly
you can see transponders with very small bandwidths, which have never been
noticed before or while monitoring DVB -T/T2 transponders you start noticing aviation
communications, also.
In the test
of the S7200, I compared the spectrum mode directly with a full-range spectrum analyser
(the Siglent SSA3000X) and came to the conclusion that the S7200 comes close to
its functionality. The main difference is that the S7200 is either set for the
frequency range of 4MHz - 1220MHz or 950MHz-2150Mhz, while the spectrum analyser
can display a continuous frequency range from 9kHz to 2.1GHz.
Turning the Deviser S7200 on
Pressing
the power button will start the S7200. After 3 seconds, a progress bar will
appear indicating the boot process, and the device is ready for operation after
15 seconds.
In the main
screen, virtual buttons appear on the right, which can be tapped directly on
the screen. You can also select these with the hardware buttons. Here you can
switch between the following modes:
The main screen changes according to the selected mode.
- TV: Measurements for analogue and digital TV transponders, as well as FM radio
- SAT: measurements for satellite receivers
- IPTV: Measurements of IPTV stations on the network
- OPM: optical measurements in fibre optic cables
- WiFI: WLAN measurements
The main screen changes according to the selected mode.
TV mode
In TV mode,
six options are available, which appear as apps: Measurements, Spectrum, Tilt,
Barscan, Passive Sweep, CNR and CTB/CS0.
If you
select measurements, all relevant parameters of the selected channel appear on the
screen. In addition, a large bar graph shows the reception level/power. This is
visible from a good distance, which simplifies the antenna alignment when the
device is put on the floor and you are looking at the screen while adjusting
the antenna.
From this
main screen you can switch to the constellation diagram. Here all possible
modulations can be displayed and zoomed in the individual quadrants.
The option
to display the constellation diagram for a selected carrier is remarkable.
Since a digital transponder consists of a large number of individual carriers,
the constellation diagram of a single carrier can be specifically displayed and
possible problems can be traced, for example when individual carriers are
disturbed by the waves of a neighbouring transponder.
The
"Passive Sweep" measurement I have encountered in yet no other TV
meter. In a first step, the user measures a reference signal, for example the
CATV signal at the output of the head station. This measurement is now stored
in the S7200 (up to 8 reference measurements can be stored). In a second step,
the S7200 is connected to a TV socket and can compare the measured signal
spectrum-similar to the selected reference signal. The advantage of this is
that the S7200 displays the deviation in dB directly on the displayed spectrum!
SAT mode
In SAT mode
three apps are available: measurements, spectrum and antenna.
As in the
TV mode, the measurements show on a screen all the relevant reception
parameters, which can also be edited directly by the user. Beneath these
parameters the screen shows: Power, CNR, MER, CBER and VBER. The power is
simultaneously displayed as a bar.
Using the
softkeys it is possible to switch to the constellation diagram or to the
antenna mode.
The
constellation diagram supports the usual modulations for satellite reception
and offers a particularly high-resolution.
The antenna
mode is used for antenna alignment and indicates the reception power of one or
more transponders of the selected satellite. At the same time, due to the
geographic position, the Deviser S7200 calculates the reception parameters of
the antenna: direction, azimuth, elevation and skew. The geographic location
can be entered manually in the configuration menu or automatically determined
using a GPS mouse. The manual input can be useful, even if you have a suitable
GPS mouse available, for example to setup a customer antenna in the workshop,
before going out for the installation.
A suitable
GPS mouse can be purchased at a favourable price because the S7200 supports the
usual NMEA protocol.
In this
app, motorized antennas are controlled, you can turn these stepwise or in time
intervals west or east and at the same time you can see the reception
performance of the selected transponders as a bar chart.
Correct
antenna positions can now be stored in the DiSEqC folder using the AUX button
(top right). All DiSEqC-1.2/USALS commands are supported, including the
commands for programming the limits.
Unfortunately
it is not possible to move the AUX window with the finger within the screen as
it does hide important screen information, while being displayed.
Optical mode
Once the optical
mode is activated and a fibre glass cable connected, its signals are converted
to RF and fed into the TS analyser.
But apart
from this built-in converter, the Deviser S7200 can actually measure the
optical power on the common wavelengths!
IPTV mode
Just as the
optical mode, the IPTV mode will act as a receiver for IPTV streams and forward
them to the TV Analyser.
As with the
Deviser S7000, the S7200 does an incredible job in detecting any IPTV stream on
the connected network cable, without any user configuration being required.
Pure magic!
TS Analyser
Conventional
modern TV field meters are normally allow the live image reproduction of
analogue and digital transponders. Even MPEG4 encoded channels can nowadays be
decoded by most current field meter.
What the Deviser
S7200 has to offer in this respect has already been shown with the previous
model, the S7000: instead of a simple TV playback, possibly with a few NIT
information, the S7200 offers a complete TS analyser!
No matter
where the transport stream comes from (via the RF input, the optical input, the
ASI input or as IPTV via the network input), a wide range of analysis options
are available.
Of course,
the picture is displayed (whether MPEG2 or MPEG4), but with the option to show
all possible parameters, too. All? Yes! Be it measurement parameters for packet
latency, bandwidth consumed by any service, even the complete NIT table can be analysed.
In extreme cases, the S7200 can even record individual packets of the transport
stream and display them as bytes in decimal or hexadecimal format.
Conclusion
With the
S7200, Deviser has developed an incredibly versatile measuring instrument whose
range of applications goes from the testing of modulators in broadcasting to
the alignment of the SAT receiving antenna of the end customer.
With a
single device complex HF situations can be displayed in the spectrum analyser,
PCR time delays can be detected with the TS analyser or the constellation of an
individual carrier can be observed within the interlocked transponder.
I could not
create a scenario in which the S7200 did not provide a suitable measurement. It
is simply the most complete TV meter in its class and the S7200 does not carry
the description "TV Signal Analyzer" for nothing!
Now some picture, which speak for themselves:
Now some picture, which speak for themselves:

Let's play with the spectrum analyser...

Setting Marker A at 956MHz by just touching the screen.

Same signal rendered by the Siglent SSA3021X - about 1.5dBm difference, which is easily explained by the DC blocker I am using here.

Detail view of a DVB-T transponder.

The TV analyser allows to monitor indiviual packets - you can even display or save the relevant bytes!

Measurment overview with all parameters on one screen. Signal power is shown as a big bar, too. Great if you are busy adjusting the antenna.

Constellation diagram - very detailed.

You can actually look at the constellation diagram of individual carriers! In this case, carrier 50 is a TPS carrier, but not much is happening...

...but there is signal on carrier 51, which is a DATA carrier.

Here another example of optical measurment, showing the simultaneous measurments of three wavelength.

Activate the optic to RF convertion and you are set to further analyse the signal!

Here we are looking at a signal delivered through optical fibre, carrying digital DVB-C transponders.

This TV operator crams a whole lot of analogue channels into the fibre! Clearly he can, because there are no significant losses during distribution. This optic to RF conversion is normally done by the router installed by the operator. In this case, the Deviser S7200 is doing it.

Smaller SPAN allows to better look at the transponders.

Measurement of an anlogue TV channel (video and audio)

No significant HUM - which is of course due to the optic distribution.

Want to look at the individual TV lines? No problem with the built-in oscilloscope mode for TV line rendering...

Measuring Video and CNR.

Measuring the timing.

This picture shows the automatic detection of IPTV broadcasts in the network. No user interaction required - all streams are found within few seconds. I have no idea how the Deviser S7200 does that!

Even in IPTV mode, it is possible to call the TS analyser and look into the contents of the transport stream.

You can look at bandwidth while rendering the life picture...

...or measure packet latency.

"Basic" information about the current TS.

Priority measurements according TR101290.

Display of all events.

Pie chart with bandwidth of each service.

PAT

NIT

Service List

Capturing individual frames

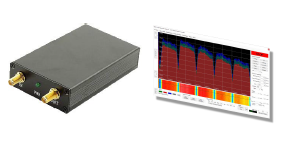
Relaxing and looking at aeronatics communication in waterfall diagram...

"This is TAP1234 approaching..."

All brief communications are visible for longer periods thanks to the waterfall diagram, which is considerably faster and with higher resolution, than on the S7000.

The S7200 is comfortable to hold with one hand or two hands.

Me measuring the optic fibre at a friends house to check if his operator (Vodafone - "fibre to home") is better than mine (NOS - "coaxial")... With the S7200 I can measure ANY signal!
You can download the datasheet here: http://www.devisertek.com/uploads/3/4/7/9/34796732/s7200_datasheet_170111.pdf

This comment has been removed by a blog administrator.
ReplyDelete